| DA NUMBERZ: |
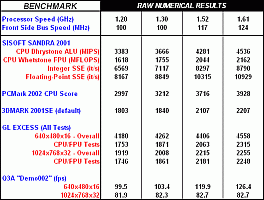
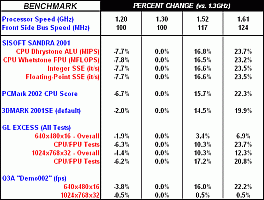
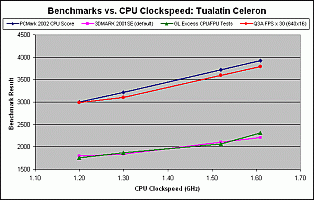
The benchmarking results obtained are summarized in two tables and a graph below.
The first table shows the raw numerical results that were obtained for each benchmark test. The second shows the percentage change in the results, using the Celeron 1.3GHz/100MHz FSB numbers as the baseline. Hence, the numbers shown for that set of tests are, by definition, all 0.0%. The remaining CPU/FSB combo results are then reported as the calculated percentage higher or lower than this baseline. For example, if the 1.3GHz Celeron gave a result of 1000 on Benchmark A, and the 1.52GHz/117Mhz combo gave 1200, then the value reported in Table 2 would be 20%.
The chart plots the results of four selected benchmarks vs. the CPU clockspeed. Here, I intentionally selected four test results that were heavily CPU-dependent, to give a clearer indication of the potential impact of the processor clockspeed on system performance. When interpreting this chart, one has to keep in mind that the actual performance increase seen from overclocking a Tualatin Celeron will almost certainly be less than this chart shows, because it is rare that a given "real world" performance characteristic will be wholly CPU-driven. As an example, this can be seen very clearly by comparing the two Quake 3 Arena benchmark results. At 640x480x16, this PC is quite clearly CPU-constrained, as shown by the large increase in frame rates obtained by boosting the processor speed. But the exact opposite is true at 1024x768x32, where the Voodoo5 video card becomes the performance bottleneck. At that resolution and color depth setting, the processor speed (at least in this range of clockspeeds) makes virtually no difference in frame rates, because the V5 simply can't pump out more than about 83fps.
One other comment on the chart--the Q3A frame rates results have been multiplied by a factor of 30 to scale them to the same approximate numerical range as the other three benchmarks. This is merely so that they can be plotted meaningfully on the same graph.
Here are the data tables and chart; click on the image of choice to see a readable version:
 |
 |
 |
||
| Table 1: Raw Benchmark Results | Table 2: Percent Change in Results | Benchmark Results vs. Clockspeed |
| INTERPRETATION OF DATA / CONCLUSIONS: |
First of all, it's important to point out a critical factor affecting these results--the benchmark result increases seen for the two overclocked conditions is not just due to the higher CPU clockspeed! Keep in mind that the mode of overclocking here (and pretty much with any current Intel processor) is to increase the front-side bus speed. The CPU clockspeed is then determined by a fixed multiplier of that bus speed, which is 13.0 in the case of the Tualatin Celeron 1.3GHz processor. But boosting the FSB speed increases the speed of other system components, as well. The system memory runs correspondingly faster, by a directly proportional amount. Also, components on the PCI and AGP buses run somewhat faster, as well, because these bus speeds are set as a fixed fraction of the FSB value. Some motherboards allow you to reduce this factor as FSB speed is increased above 100MHz, but the AOpen AX6BC used in this study doesn't have that capability. So, the results obtained at the 1.61GHz processor speed (FSB = 124MHz) are significantly higher than you would see if Intel made a 1.61GHz version of the Tualatin Celeron that ran at the standard 100MHz bus speed. But even if the boost is not 100% attributable to the CPU clockspeed increase, it is no less real!
This point also raises the issue that, when overclocking via the FSB speed, it's important that the other components in a system are up to the task. For instance, a PC that employs cheap PC100 RAM that barely meets that performance spec may very well be unable to run at 117 or 124MHz. Other components like a hard drive or video card may also not be able to withstand higher bus speeds, though good quality components will generally have some "headroom" in this regard. However, if you try FSB overclocking and can't get the system to run, keep in mind that it may not be the CPU that's the problem!
One set of results to be cautious about is the Sisoft Sandra numbers. These results come from a combination of two benchmark tests that are purely CPU clockspeed-driven. I include them here more as a confirmation of the reported processor clockspeeds than as a true performance indicator. If you "do the math" on the ratio of the various clockspeeds vs. the 1.3GHz baseline, you'll see that the resulting calculation is virtually identical to the ratio of the corresponding Sandra CPU test results. So the Sandra numbers really aren't telling you much.
The 24% overclock demonstrated here for the 1.3GHz Celeron is respectable, though not stellar. It's certainly nothing to sneeze at, since a number of the benchmarks showed gains in the 20% range. Though "real world" applications would likely benefit to a somewhat lesser degree, getting that kind of performance increase at no cost (other than a few minutes of your time) seems like an awfully good deal! And I would expect that the 1.2GHz Celeron should overclock similarly, if not a bit better on a percentage basis, since it starts at a lower value.
BOTTOM LINE:
If you have a BX motherboard that allows FSB overclocking and the rest of your system is up to the challenge, give it a try on the new rev.2 iP3/T and the Tualatin Celeron of your choice. But, as always, remember that you do this at your own risk. Powerleap does not officially endorse overclocking on their product (who does??), so you will likely be voiding your warranty if you overclock.
Back to the main iP3/T review page.... Check out Duh Voodoo Man's Home Page
