| DA NUMBERZ.... |
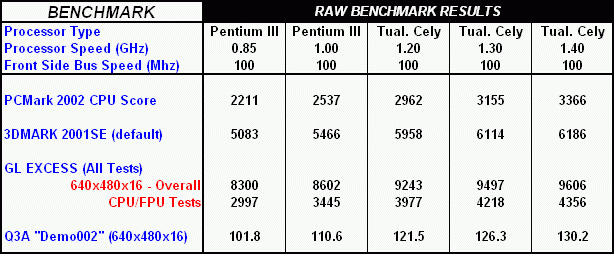
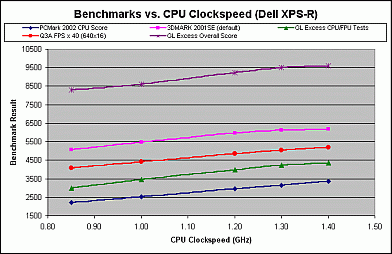
The following table gives the raw benchmark data for the five processors tested. For the GL Excess video benchmark, two values are shown--the overall score (a composite of four test results) and the CPU/FPU score (one of those four tests). Not surprisingly, the results show a steady upward trend on all benchmarks with increasing processor clockspeed. This is better visualized in the accompanying chart. As you can see, the increase is fairly linear in all cases, with the results of the tests being nearly parallel to each other. As I've stated in the past, this substantiates the fact that the Tualatin Celeron and the 100MHz FSB versions of the Coppermine P3 have very similar performance at equivalent clockspeeds. If they didn't, you'd see some kind of discontinuity between the P3-1GHz and 1.2GHz Celeron points on these curves, but nothing of the kind is apparent in the data. By the way, the Q3A framerates were all multiplied by a factor of 40 to get them to the same approximate scale as the rest of the data. So, no, I wasn't getting 4000 fps in timedemo mode!!
 |
 |
|
| Click on chart to enlarge |
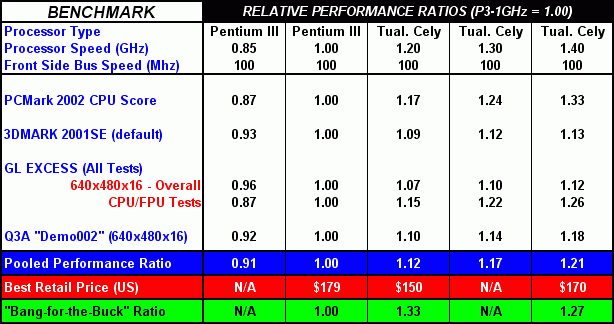
The next table boils this all down to a relative performance comparison. Here, I have "normalized" the data by dividing each benchmark result by the score that the P3-1GHz processor produced. Thus, by definition, all of the P3-1GHz performance ratios are 1.00. I chose the P3-1Gig as the baseline because it is the "end of the line" for the 100MHz FSB Coppermine P3's, and a good reference point for comparing the PowerLeap products. Any value greater than 1.00 represents better performance than the P3-1GHz, and a number under that value is worse performance. For example, the PowerLeap/Tualatin Celeron 1.4GHz with a performance ratio of 1.18 on the Q3A benchmark indicates that it gave an 18% higher result on that test.
From these normalized results, I then calculated a "pooled" overall performance ratio by averaging the ratios of the four different benchmarks. As I have seen in previous studies, the actual performance boost seen in a CPU upgrade is about half of the increase in clockspeed. For example, the Celeron 1.4GHz is clocked 40% higher than the P3-1GHz, but the observed performance increase here was only 21%. The 1.2GHz Cely falls about halfway in between, at 12%.
Finally, I use that data together with the lowest available current price for these processors to calculate a "bang-for-the-buck" ratio. On that basis, the best speed-for-the-dollar is the 1.2GHz Celeron at 1.33. However, the 1.4GHz is close behind at 1.27, and many people will probably want to spend the extra $20 for the incremental 9% of performance. Notice that no price data is given for the P3-850MHz or the PowerLeap 1.3GHz Celeron. That's because the 850 has disappeared from circulation (at least, I can't find a new one listed anywhere here in the US), and PowerLeap has stopped offering the 1.3GHz now that the 1.4 has arrived.

| OVERCLOCKING, ANYONE?? |

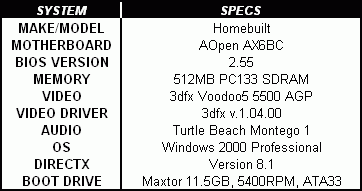
With the baseline performance of the new 1.4GHz Celeron established, it was time to try puttin' the spurs to her a bit. Since my Dell XPS-R does not allow FSB overclocking, I moved the 1.4GHz PowerLeap rig over to my web server (see configuration specs at right) and it's FSB-adjustable AOpen AX6BC mobo. I also ran the 1.2 and 1.3GHz rigs on the machine at the default 100MHz FSB, to establish a performance comparison baseline on this PC. The AOpen board does not allow a "continuous" adjustment of FSB in 1MHz increments, as many newer mobos do, so I had to use the available FSB setting choices. I started out at 112MHz, translating to a CPU clockspeed of 1.57GHz. The PC locked up during Windows load, so I boosted the core voltage to 1.60 - 1.625v and the machine booted normally. After completing the benchmarks, I rebooted and changed the FSB setting to 117GHz (1.63GHz CPU), with the voltage preemptively turned up to 1.65 - 1.675v. The PC loaded Windows normally and the benchmarks were completed without incident. Flush with success, I booted again, turning the FSB up to 124MHz (1.74GHz). Uh-uh, no way, no how!! Even with voltage maxed out at 1.8v, the machine wouldn't even get to the Windows desktop before freezing up. So this speed was obviously beyond the capability of the CPU. That's consistent with previous overclocking studies I'd done on the 1.3GHz Tualatin Celeron, where 1.61GHz was the highest speed I could stably attain. I suspect that 1.7GHz is simply outside of the capability of the Tualatin Celeron core, at least without going to heroic cooling measures of some sort.
A couple of comments on the benchmarks that I ran: I employed the same test battery that I used for the initial 1.4GHz comparison benchmarking, but with one notable exception. It seems that the Voodoo5 5500 video card in the PC just wouldn't get along with 3DMark2001 SE, and the test kept crashing back to the desktop. So I had to make do without it here--too bad, because this is the de facto standard video benchmark that people typically use these days. C'est la vie! Also, vsync was disabled and antialiasing was turned off for all tests, as before.
Now that you are breathless with anticipation, proceed to the next page to see the results....
 |
 |